Score Indicator
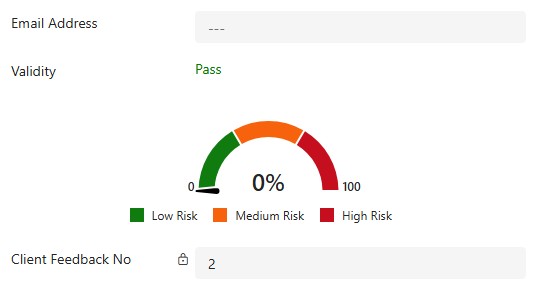
Score Indicator
A control that displays a whole number value (0–100) using a modern Fluent UI React gauge chart. It provides a clean, responsive visual to represent scores like credit, performance, or ratings. Perfect for dashboards and data-driven forms.
Author: Sayan Roy

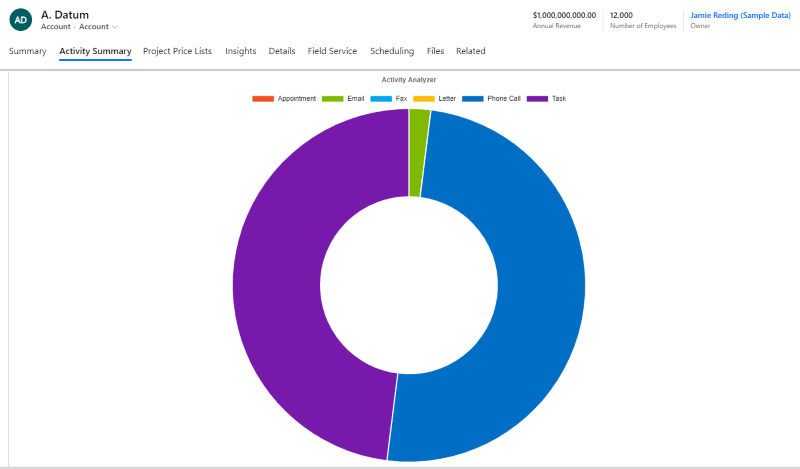
Activity Analyzer
A control to show activity subgrid in a doughnut chart using <a target="_blank" href="https://www
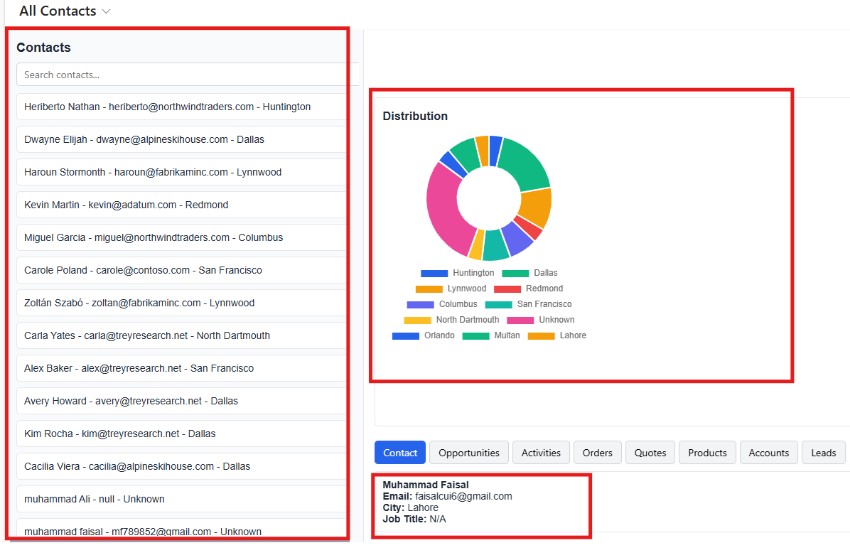
Contact Details Dashboard Control
A control to make customer relationship data visual, interactive, and easy to explore.
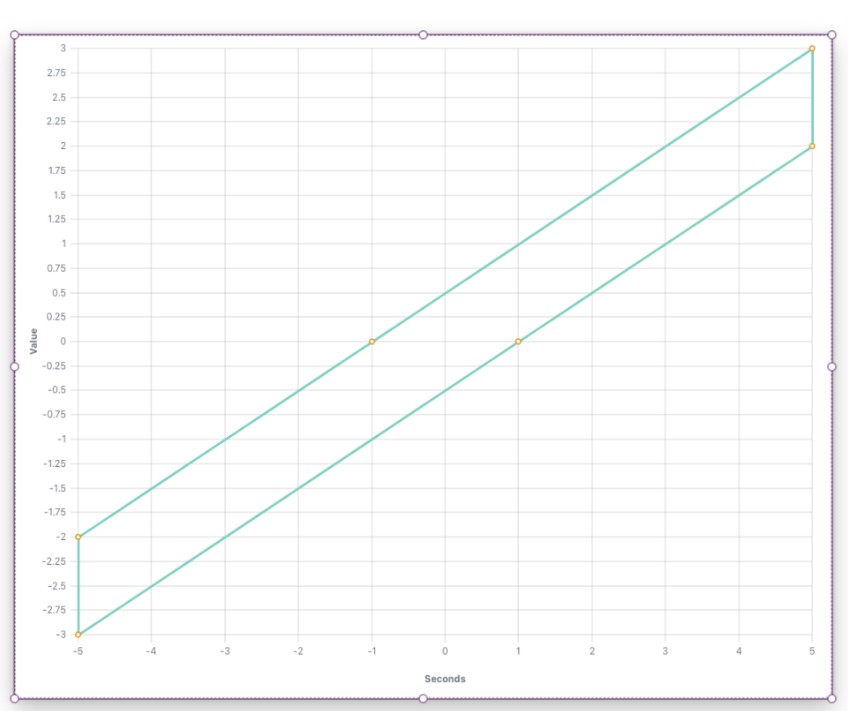
CurveChart PCF
A control for Canvas apps and Custom Pages that renders interactive XY curve/line charts from JSON.